Your operations.
Your data.
Your perimeter.
Operational monitoring that runs entirely inside your environment.
Telemetry never leaves.
When something must reach an external desk, one governed gate decides.
Sovereign by default · Governed on exit.
To watch your systems,
most tools make you export them.
Observability means shipping your logs, metrics, and traces to a vendor's cloud.
In regulated, air-gapped, and sovereignty-bound environments, the data that describes your operations becomes data you no longer control.
Your operations
never leave your perimeter.
Vorsa is customer-hosted and runs entirely on your infrastructure — on-premises, air-gapped where you need it. No telemetry, no metadata, no phone-home. You control the data and the database.
- Telemetry, signals, and incidents
- Topology and dependency graph
- Operational history and audit
- Your PostgreSQL database
One path out: a redacted support-case dispatch to a service desk you configure — previewed before it sends, and recorded after.
How the gate works
Nothing leaves
without passing the gate.
Vorsa's one deliberate outbound path is a support-case dispatch to a service desk you configure. It clears a governed sequence built to survive a security review.
Three independent conditions must all hold before a single connector call is made — and the gate fails closed.
- The operator previews the exact bytes — byte-identical to what transmits
- Redaction is applied before anything is rendered for sending
- Every dispatch is a durable record: its own identity, state machine, and attempt ledger
- An append-only audit log — no state change without an entry
- Idempotent reconciliation — a lost confirmation is repaired, never resent, so a desk never sees a duplicate
Two ways to run.
Both stay inside.
Vorsa installs its own PostgreSQL, or connects to the instance you already run — your choice, set at install time.
Vorsa-managed database
Vorsa installs and runs its own PostgreSQL. Nothing to provision — the platform brings its own data layer.
- Self-contained install
- No external database required
- Runs air-gapped
Bring your own PostgreSQL
Point Vorsa at the instance you already operate. A connect-time preflight verifies version, privileges, and connectivity before anything is touched.
- Uses your existing PostgreSQL
- Preflight checks before install
- Fits your DBA and backup policy
Backups are scoped to Vorsa's own schema. A Vorsa backup artifact can never contain another application's data — even when Vorsa shares your existing database instance.
What Vorsa does
inside your perimeter.
Continuous operational monitoring for complex and regulated environments. Every capability here runs today — no external dependencies, nothing leaving your network.
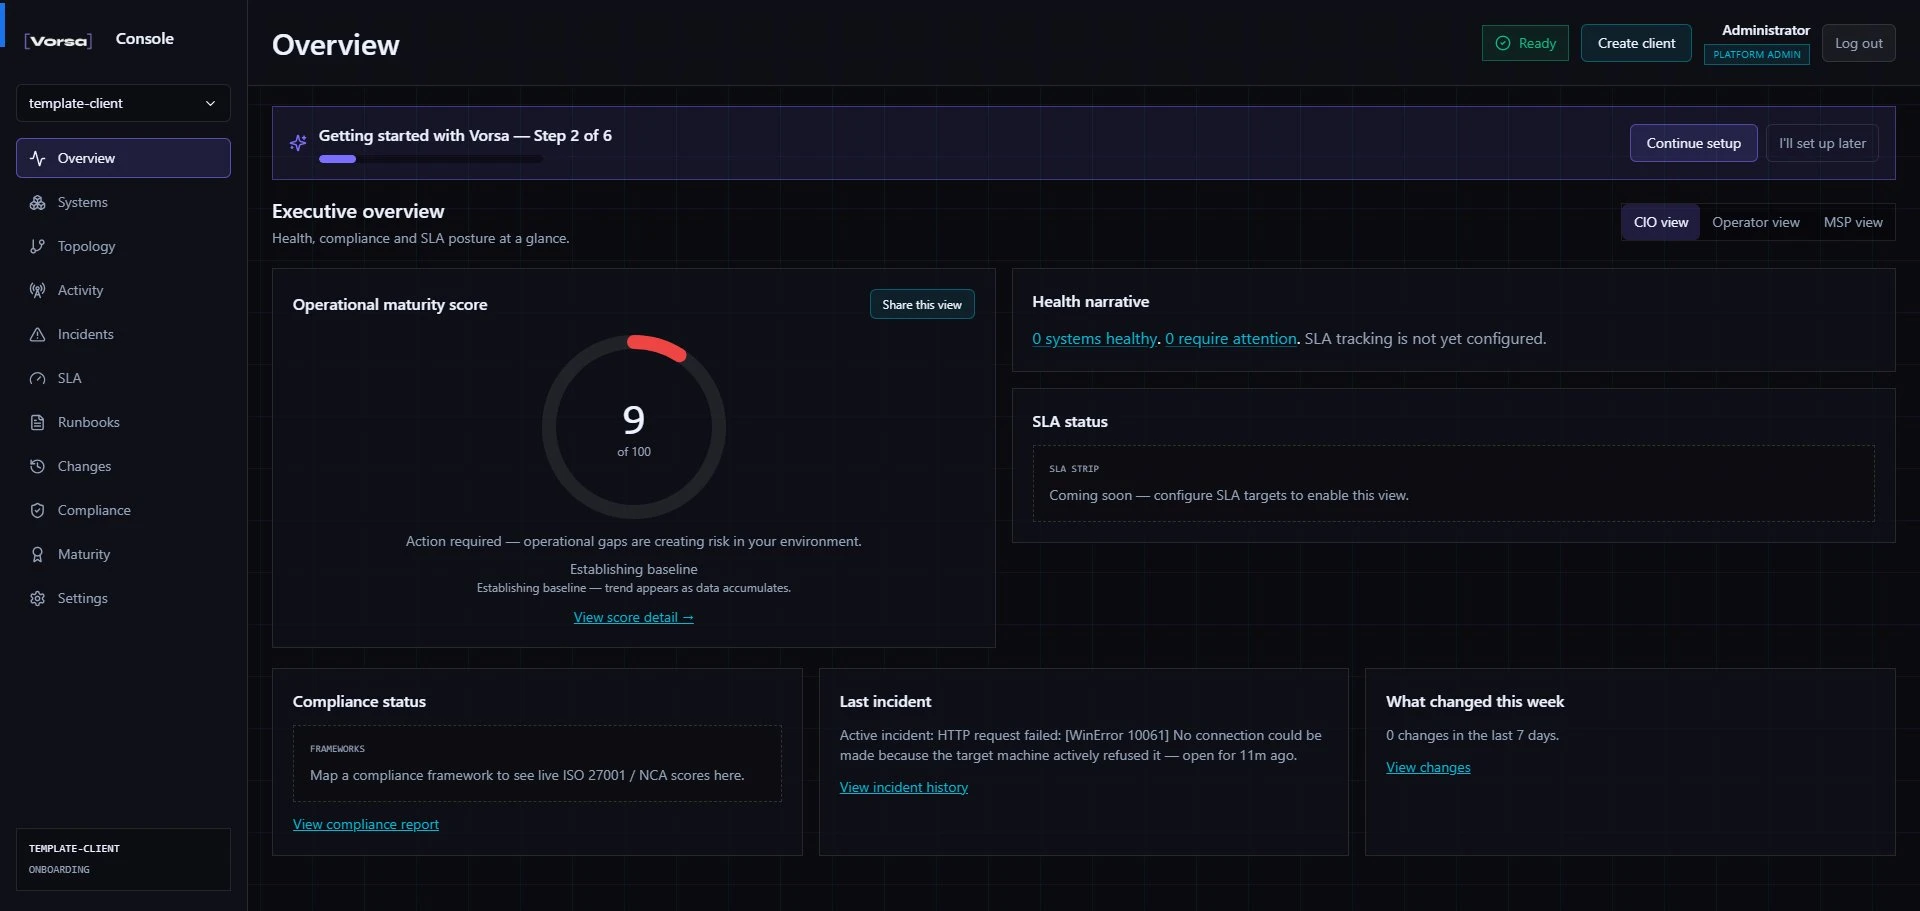
Operational maturity, at a glance.
One executive view of maturity, health, compliance, and the latest incident — read from your own environment.
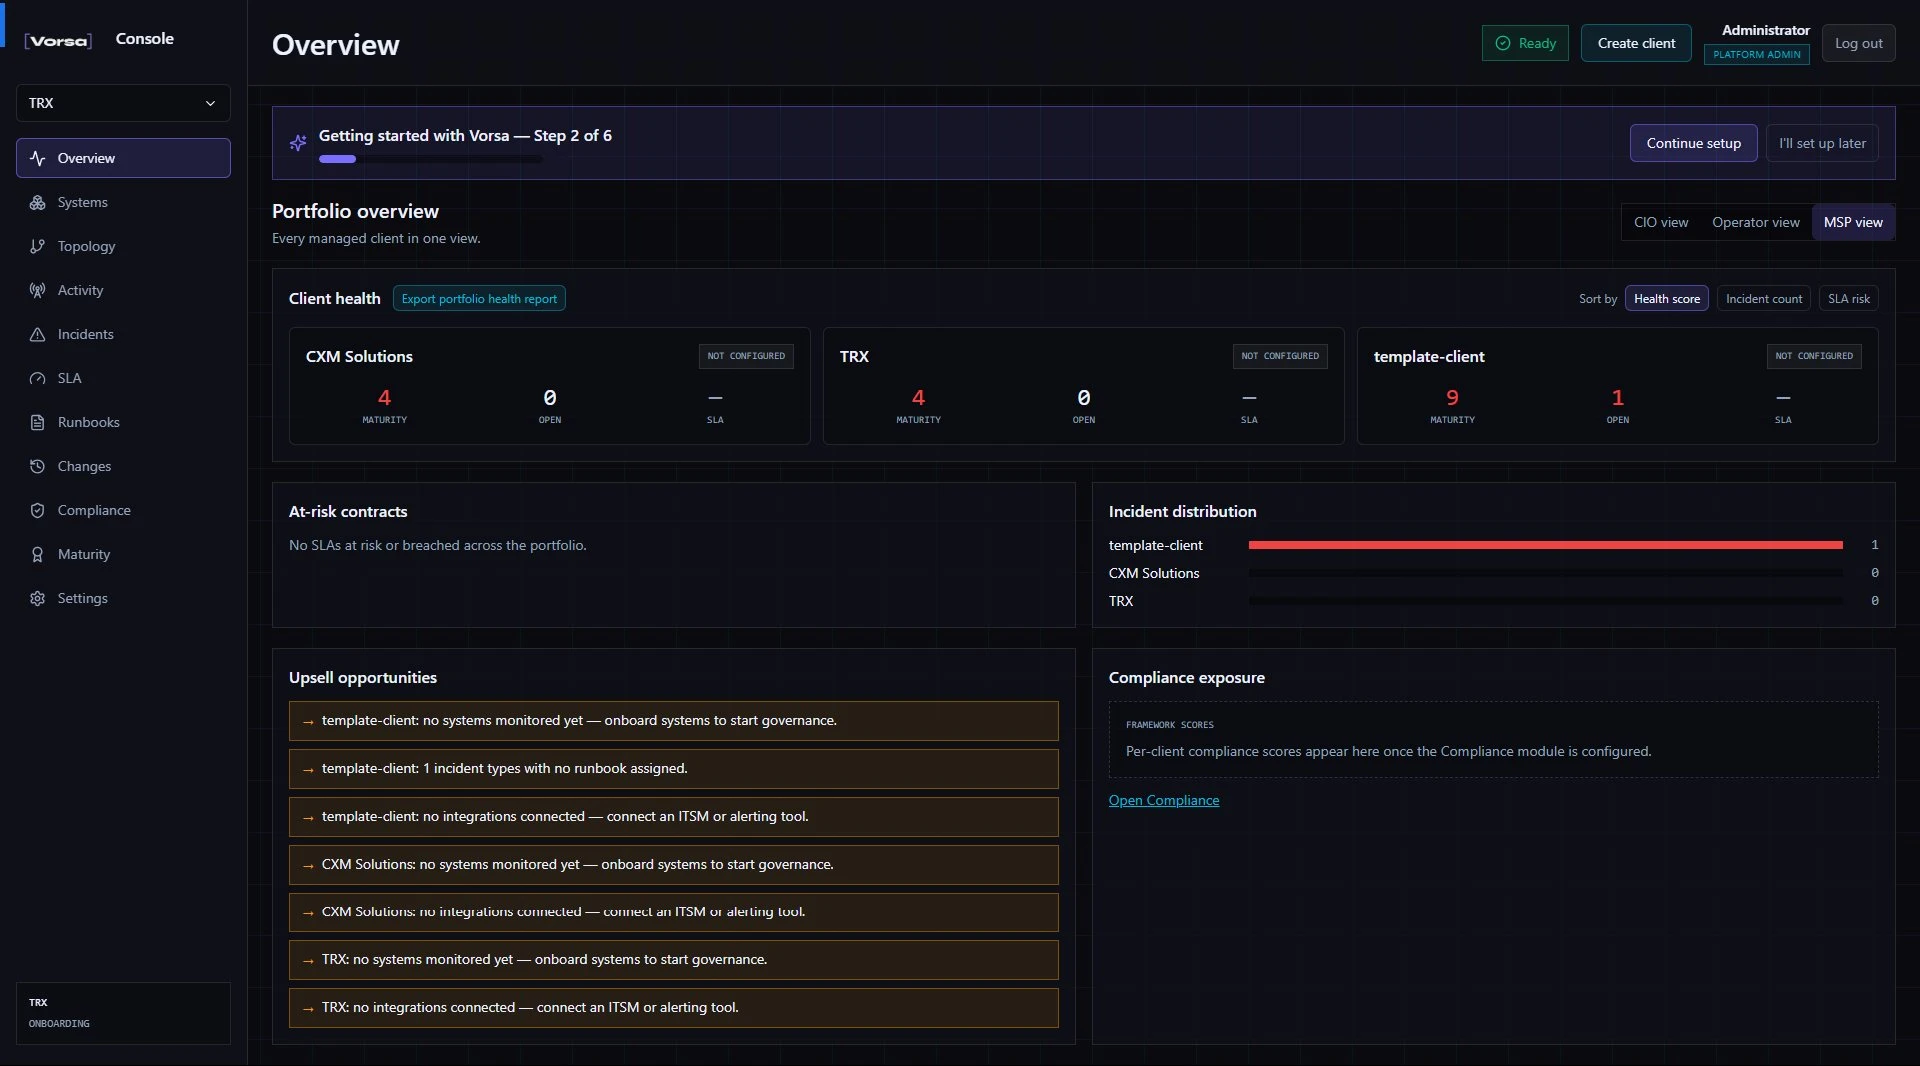
Every client. One operational view.
Prioritize every managed client by maturity, open incidents, and SLA exposure.
The difference isn't features.
It's where your data lives.
For regulated environments the deciding question isn't what a tool shows — it's whether your operational data ever leaves your control.
What runs today.
Vorsa monitors, correlates, and governs egress today — the operational pipeline below runs end to end.
One sovereign platform. Every team.
Leadership sees posture. Operations sees the estate. Engineering sees blast-radius. Support gets a governed handoff. None of it leaves your network.
See posture without the data leaving
One executive view of maturity, health, and compliance — computed entirely inside your environment.
- Operational maturity score
- Compliance posture
- Nothing leaves your perimeter
One monitored view of the estate
Track systems, incidents, and SLA exposure across everything you run.
- Systems & service health
- Incident tracking
- SLA exposure
See what a failure can reach
A live dependency graph with traversable blast-radius across services, data, and infrastructure.
- Topology & dependencies
- Blast-radius traversal
- Change tracking
Correlated incidents, not raw alerts
Incidents are correlated from configurable rules and deduplicated into a single record.
- Rule-based correlation
- Deduplicated incidents
- Approval-gated runbooks
Know which change mattered
Change tracking ties what changed to the systems it touched.
- Change history
- Dependency context
- Approval-gated execution
Escalate with a governed handoff
Raise a support case to your service desk through a previewed, redacted, audited dispatch.
- Governed ITSM dispatch
- Previewed & redacted
- Full audit trail
Keep operational truth inside
Run monitoring in regulated and disconnected environments without moving data outside.
- Air-gapped operation
- Customer-controlled data
- Per-client portfolio view
Put operational monitoring
inside your perimeter.
Book a walkthrough of Vorsa in a sovereign, on-premises deployment — including the governed egress path your security team will want to review.